The workspace panes
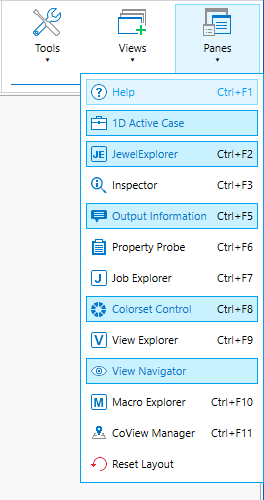
The panes available in JewelSuite Geomechanics click to enlarge
Data objects, properties of objects, and other types of information can be easily viewed using the various panes available to you. By default, they are shown on the left or right side of the user interface or below your view area.
You can show and hide the various types of panes using the Panes drop-down list in the Workspace section on the right of the Strip. A blue border around the pane's name in the list indicates that it is currently being displayed. Click on it to hide it. Click on a pane without a blue border to show it.
Panes can share the same area in the layout of the application. You can view a particular pane by clicking its tab at the bottom of that area.
By clicking the icons in the top right corner of a pane, you can do the following:
- You can dock a pane by clicking the horizontal pin
 icon.
icon. - You can auto hide a pane by clicking the vertical pin
 icon. The panes will then collapse into a narrow border at the side of the screen. Click on the icon or name of the pane in this border to show the pane again. You can switch between auto hidden panes by clicking on them.
 - You can close a pane by clicking the close
 icon.
icon.
To completely detach a pane from the main application window, click on the title bar of the pane and drag it to your desired location. Another way of detaching a docked pane is double clicking on the title bar. To reattach a pane, drag it back over the application, and use the Dock Manager to dock it at the desired location.
You can also quickly show and hide particular panes using the function keys on your keyboard.
Help (Ctrl + F1) opens the Dynamic Help. You can use the Dynamic Help to view specific information on the workflow or form you are working with, or open the complete manual.
The 1D Active Case pane lets you select which well you are working with.
The JewelExplorer (Ctrl + F2) lets you view all the objects and properties that you have created or imported into your project.
The Inspector (Ctrl + F3) allows you to view detailed information on any of your objects and also hosts the information provided by the Dynamic Help (Ctrl + F1).
Output Information (Ctrl + F5) displays any error, warning, information and logging messages.
Property Probe (Ctrl + F6) displays the selected object, the selected coordinate and property values at the location of the selected object in the 3D View.
The Job Explorer (Ctrl + F7) lets you view and manage all the jobs that are running as background tasks.
Colorsets (Ctrl + F8) lets you create and manage colorsets that you can use to visualize object properties in your views.
Many of the views support multiple instances that you can manage via the View Explorer (Ctrl + F9), which lets you show or hide individual views or view groups.
The View Navigator displays a list of all the views in your solution. To make a view active, click the view in the list.
The CoView Manager (Ctrl + F11) is where you control the display of elements, data and annotations visible on the canvas in the CoView.
Access the Well Engineering Center (WEC) application and manage your task via Well Engineering Center.
The auto-saved layout
The locations and sizes of your panes are saved automatically when you close the application. They will be restored when you open it again.
Resetting your layout
To reset the positions to the default, select Panes > ![]() Reset Layout in the Workspace section on the right of the Strip.
Reset Layout in the Workspace section on the right of the Strip.